Megatrends
Applications
Products
Career
Company
EN
Flow measurement in smart inhalers for connected drug delivery
Bioreactors
Thermal-mass gas metering
Market trends in refrigerant leakage detection
The thermal-mass measurement principle
Monitoring CO₂ concentration
The future of improving indoor air quality
HVAC macro trends
Breaking the size barrier in CO₂ sensing
Autonomous Science
Flow measurement in smart inhalers
Flow sensor solutions in modern medical ventilators
Challenges in personalized medicine
State-of-the-art filter monitoring
Measuring lowest flow rates in medical therapies
New possibilities in diagnostics
Single-use proximal flow sensors
Efficient gas flow measurements in bypass
Liquid flow sensors for drug delivery
Particulate matter sensing for air quality measurements
Thermal-mass gas meter modules
NIST traceability, ISO17025 certification and commodity temperature sensing
Calorific value: fiscal measurement in the multi-gas era
Thermal flow measurement: High-flow sensor for laboratory analytics and industry
Formaldehyde detection
Real-time monitoring of residential water filters
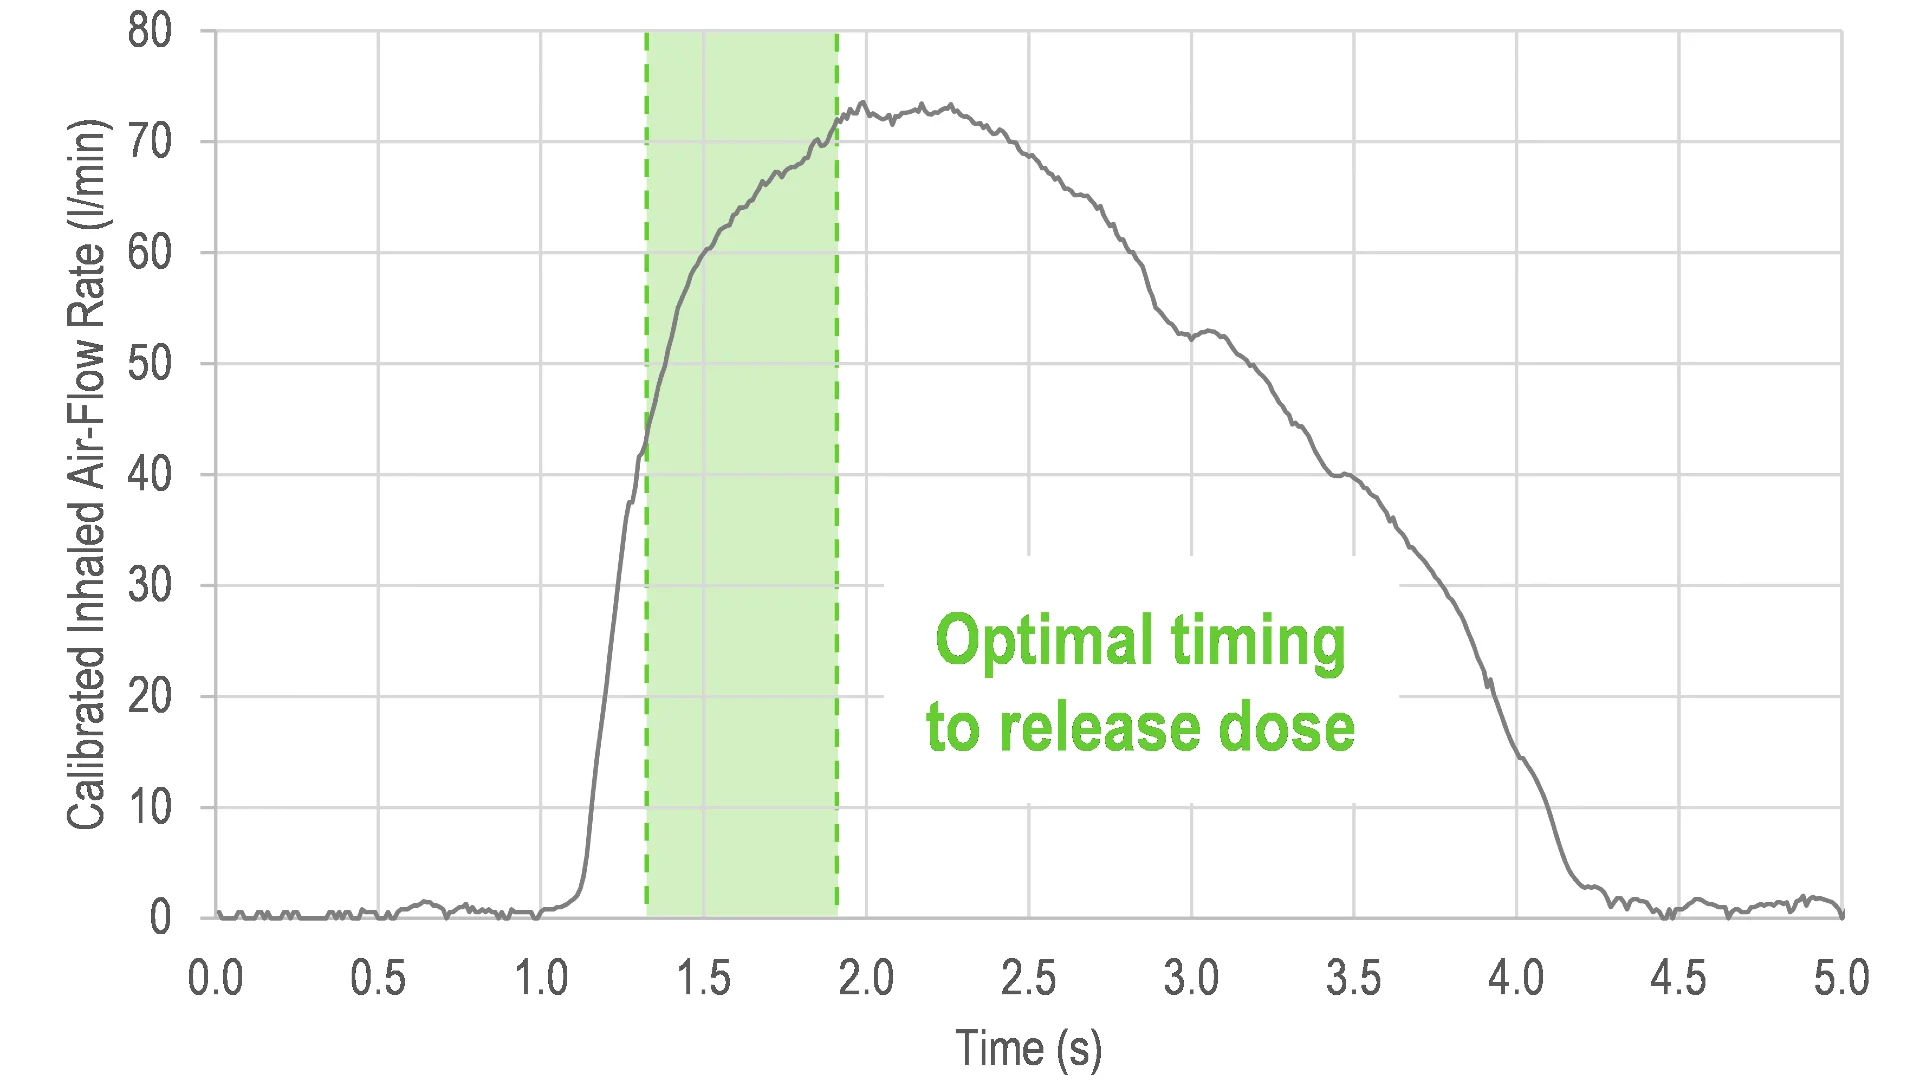
Figure 1: Inhalation flow profile - calibrated flow rate in standard liters per minute (l/min) vs inhalation time in seconds (s)
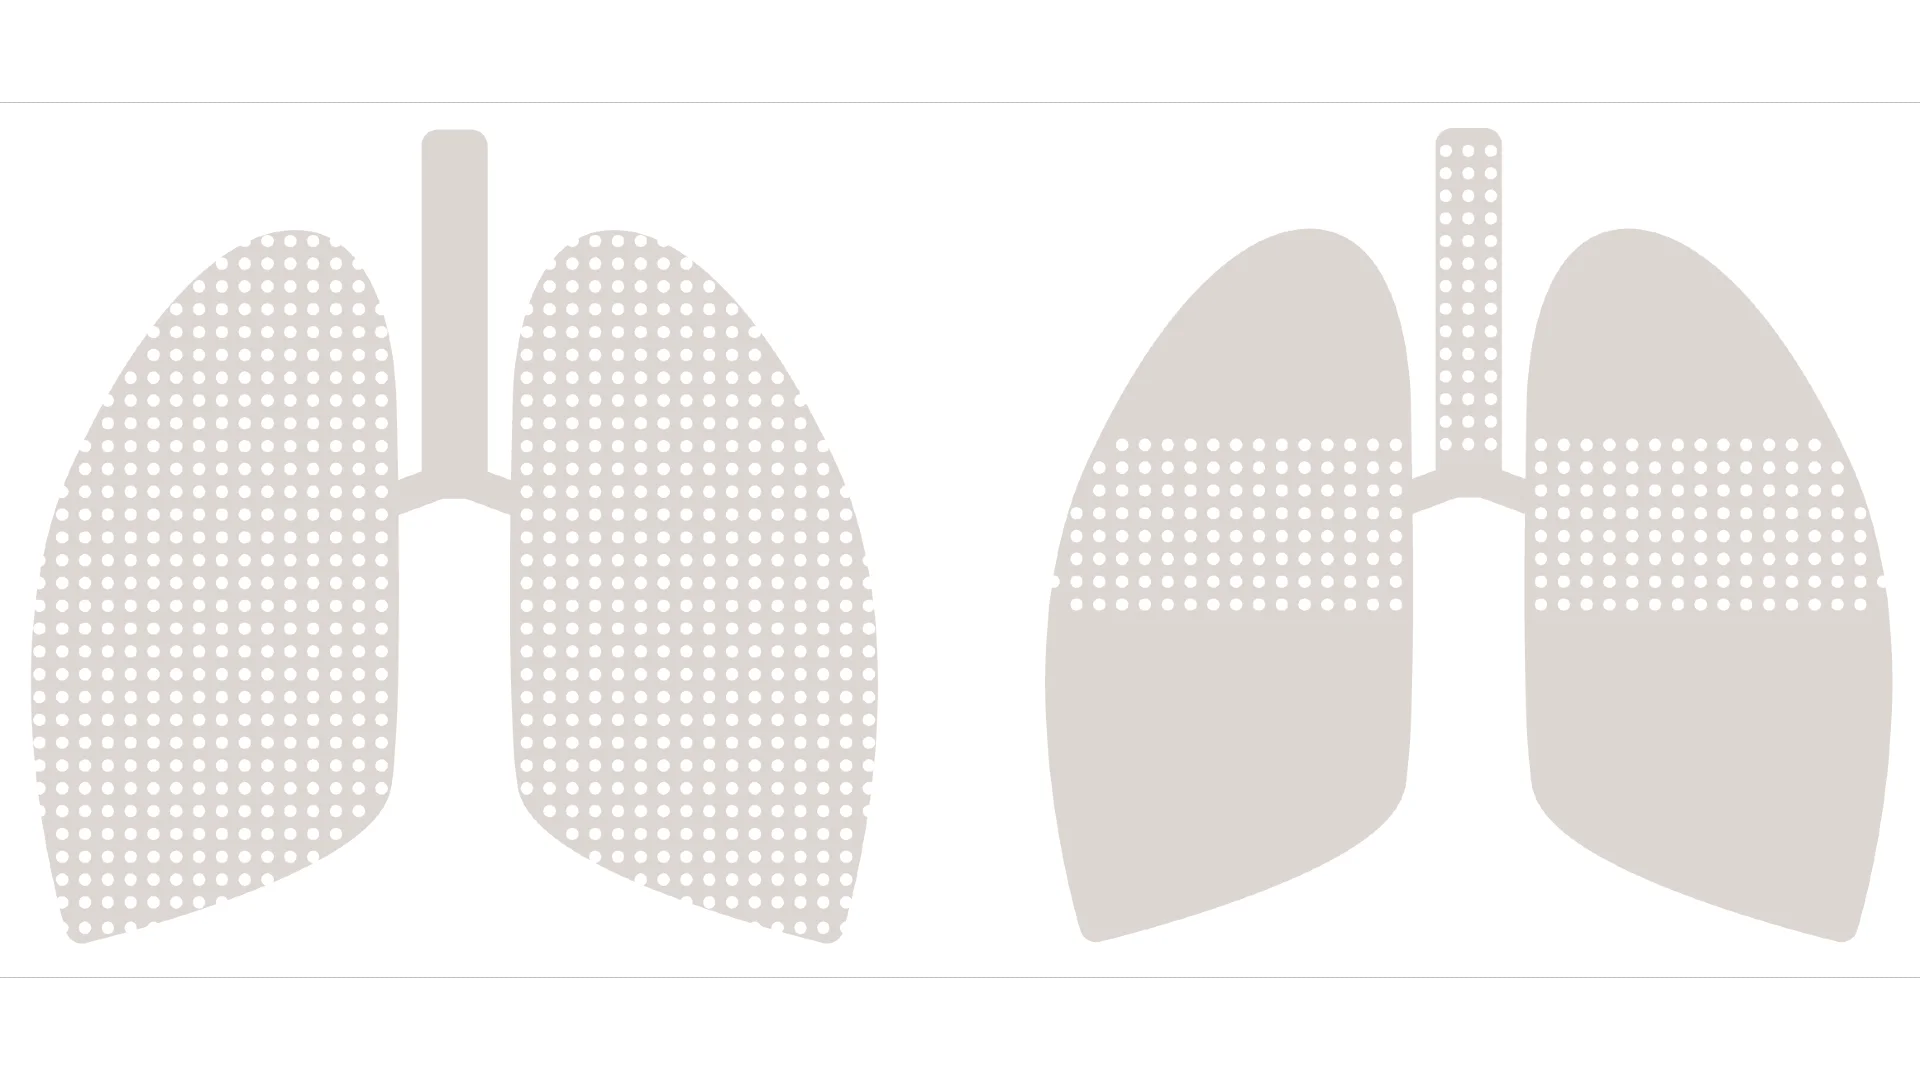
Figure 2: Drug deposition when drug is released in optimal timing window (left) vs when drug is released too late (right)
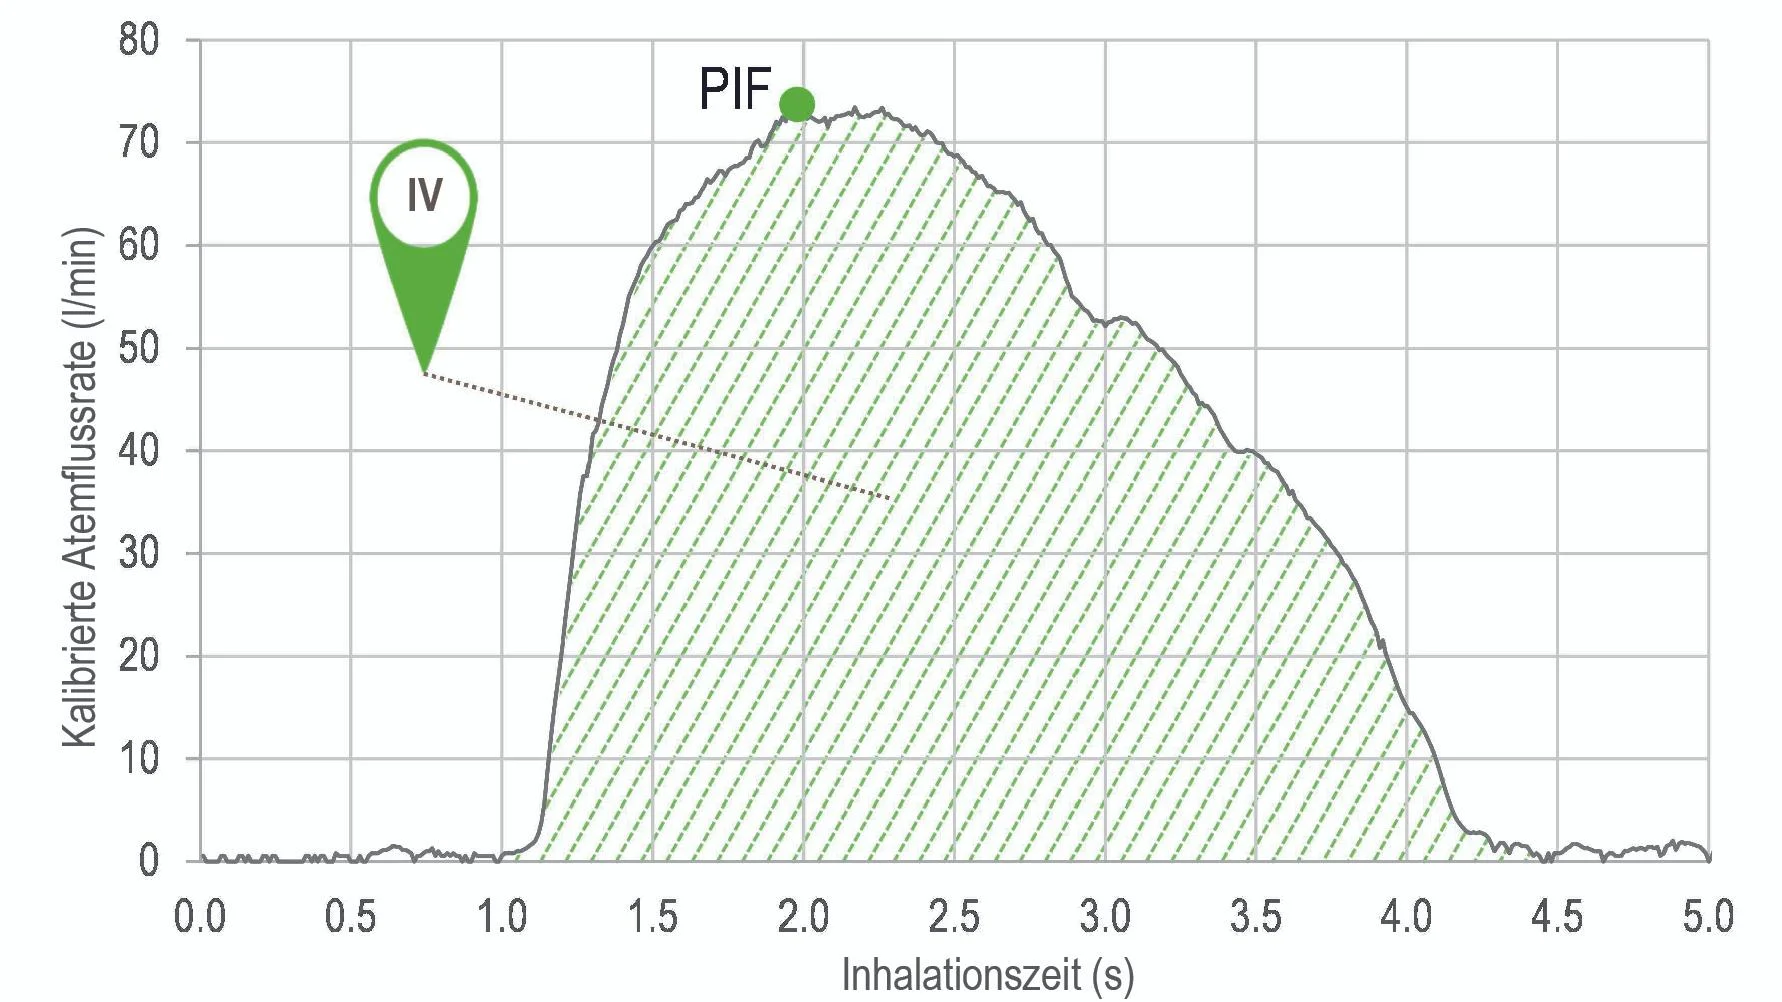
Figure 3: Parameters derived from the inhalation airflow characteristic
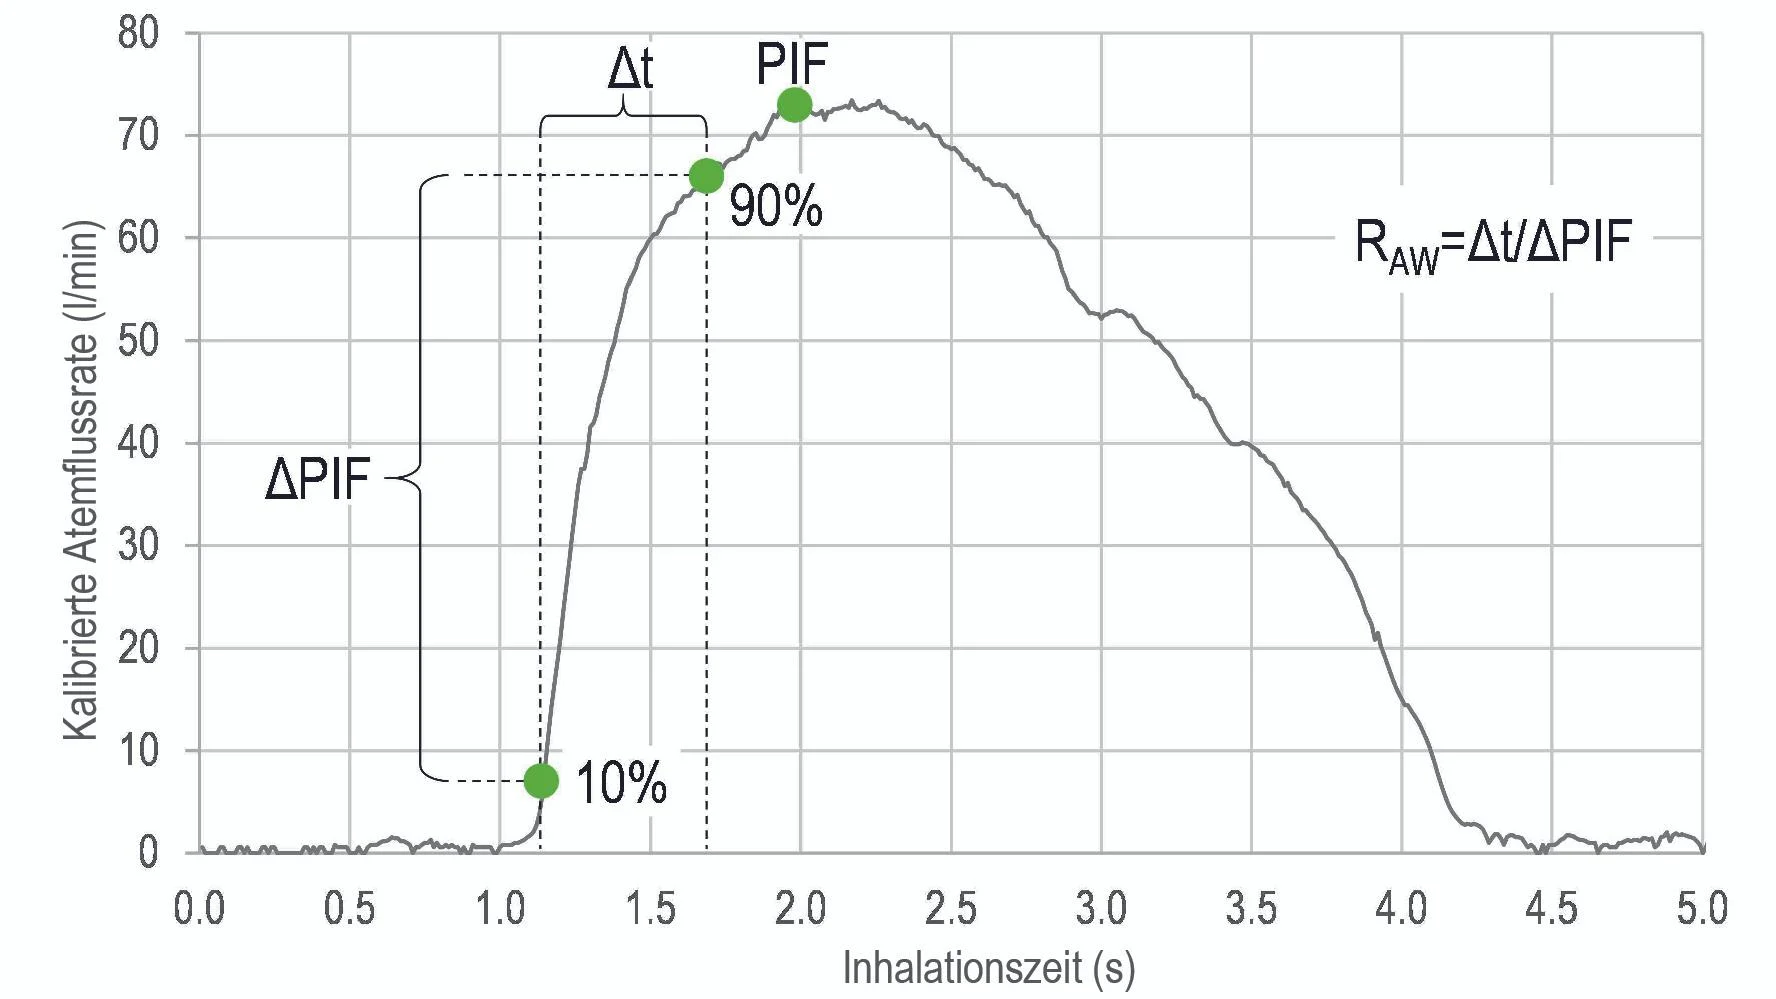
Figure 4: Airway resistance (RAW) can be determined from calibrated inhalation airflow characteristics
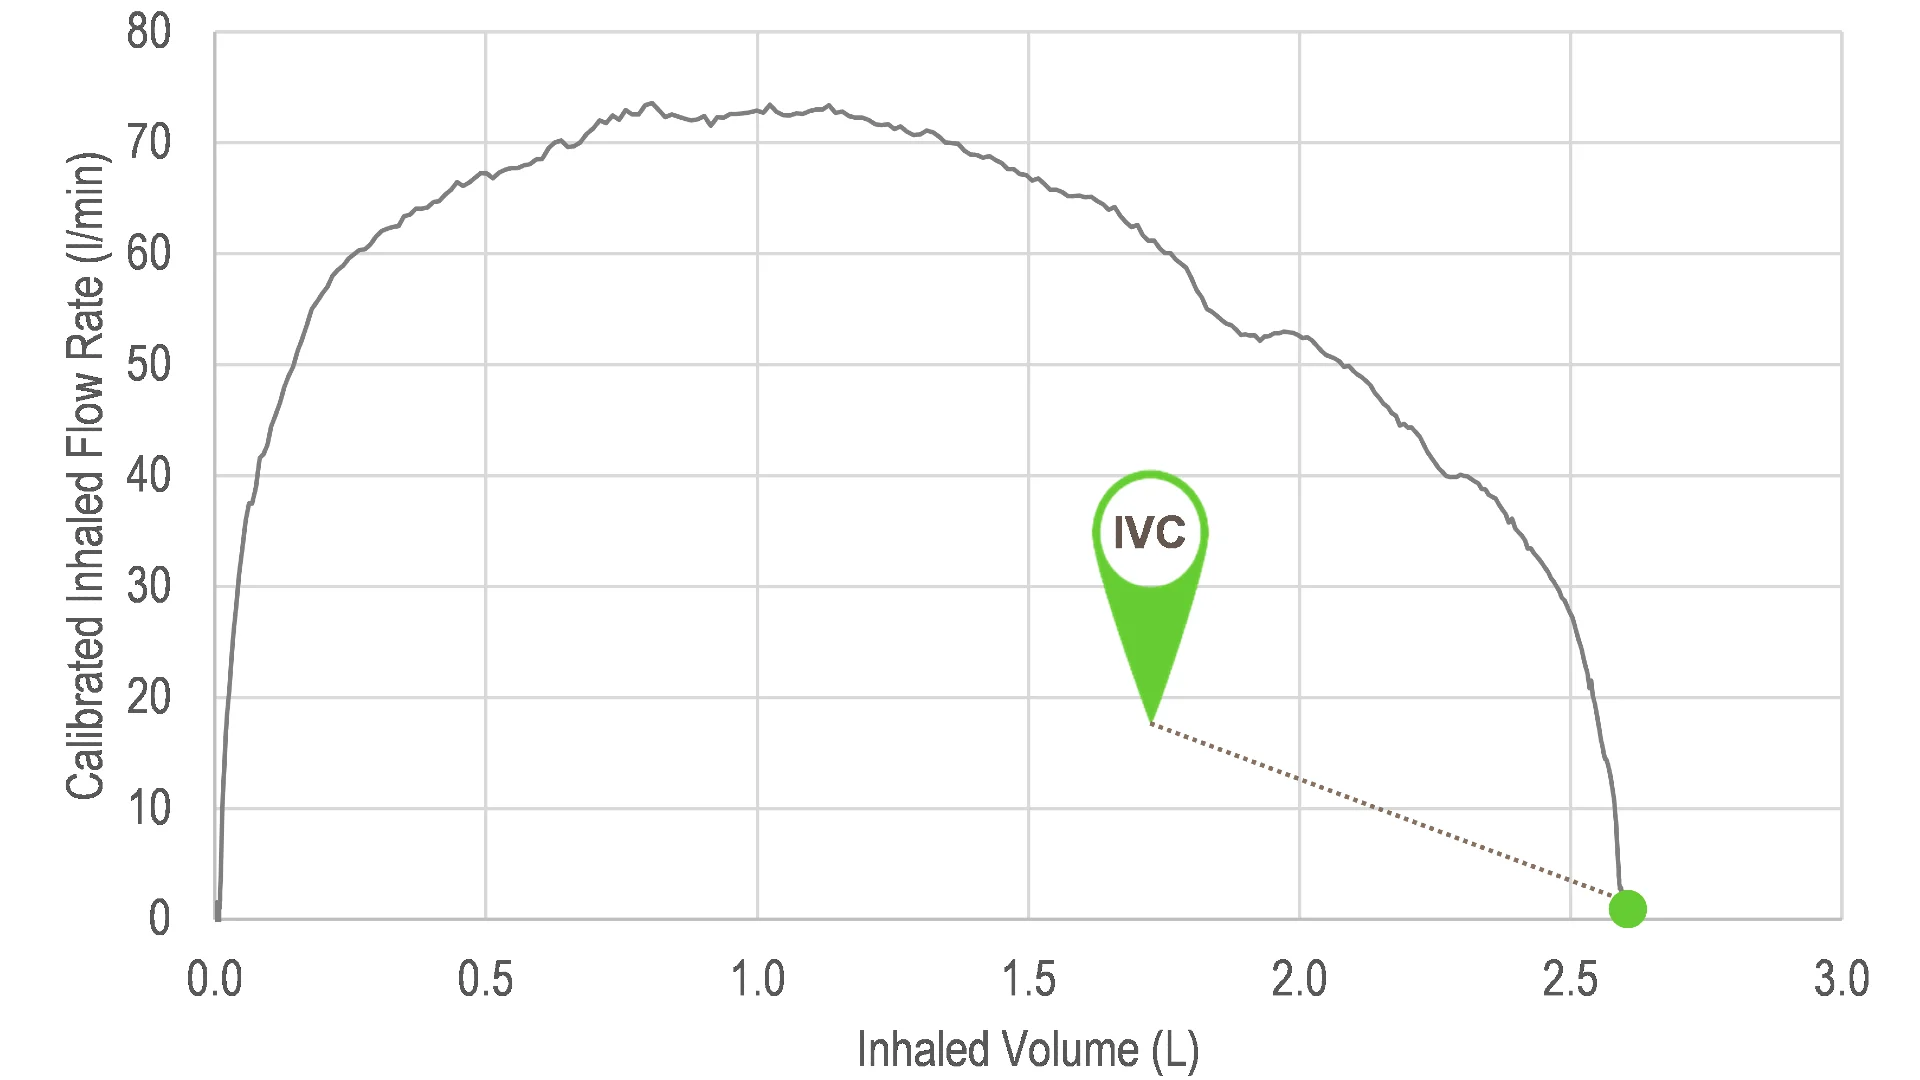
Figure 5: Typical spirometer plot of flow rate versus inhaled volume
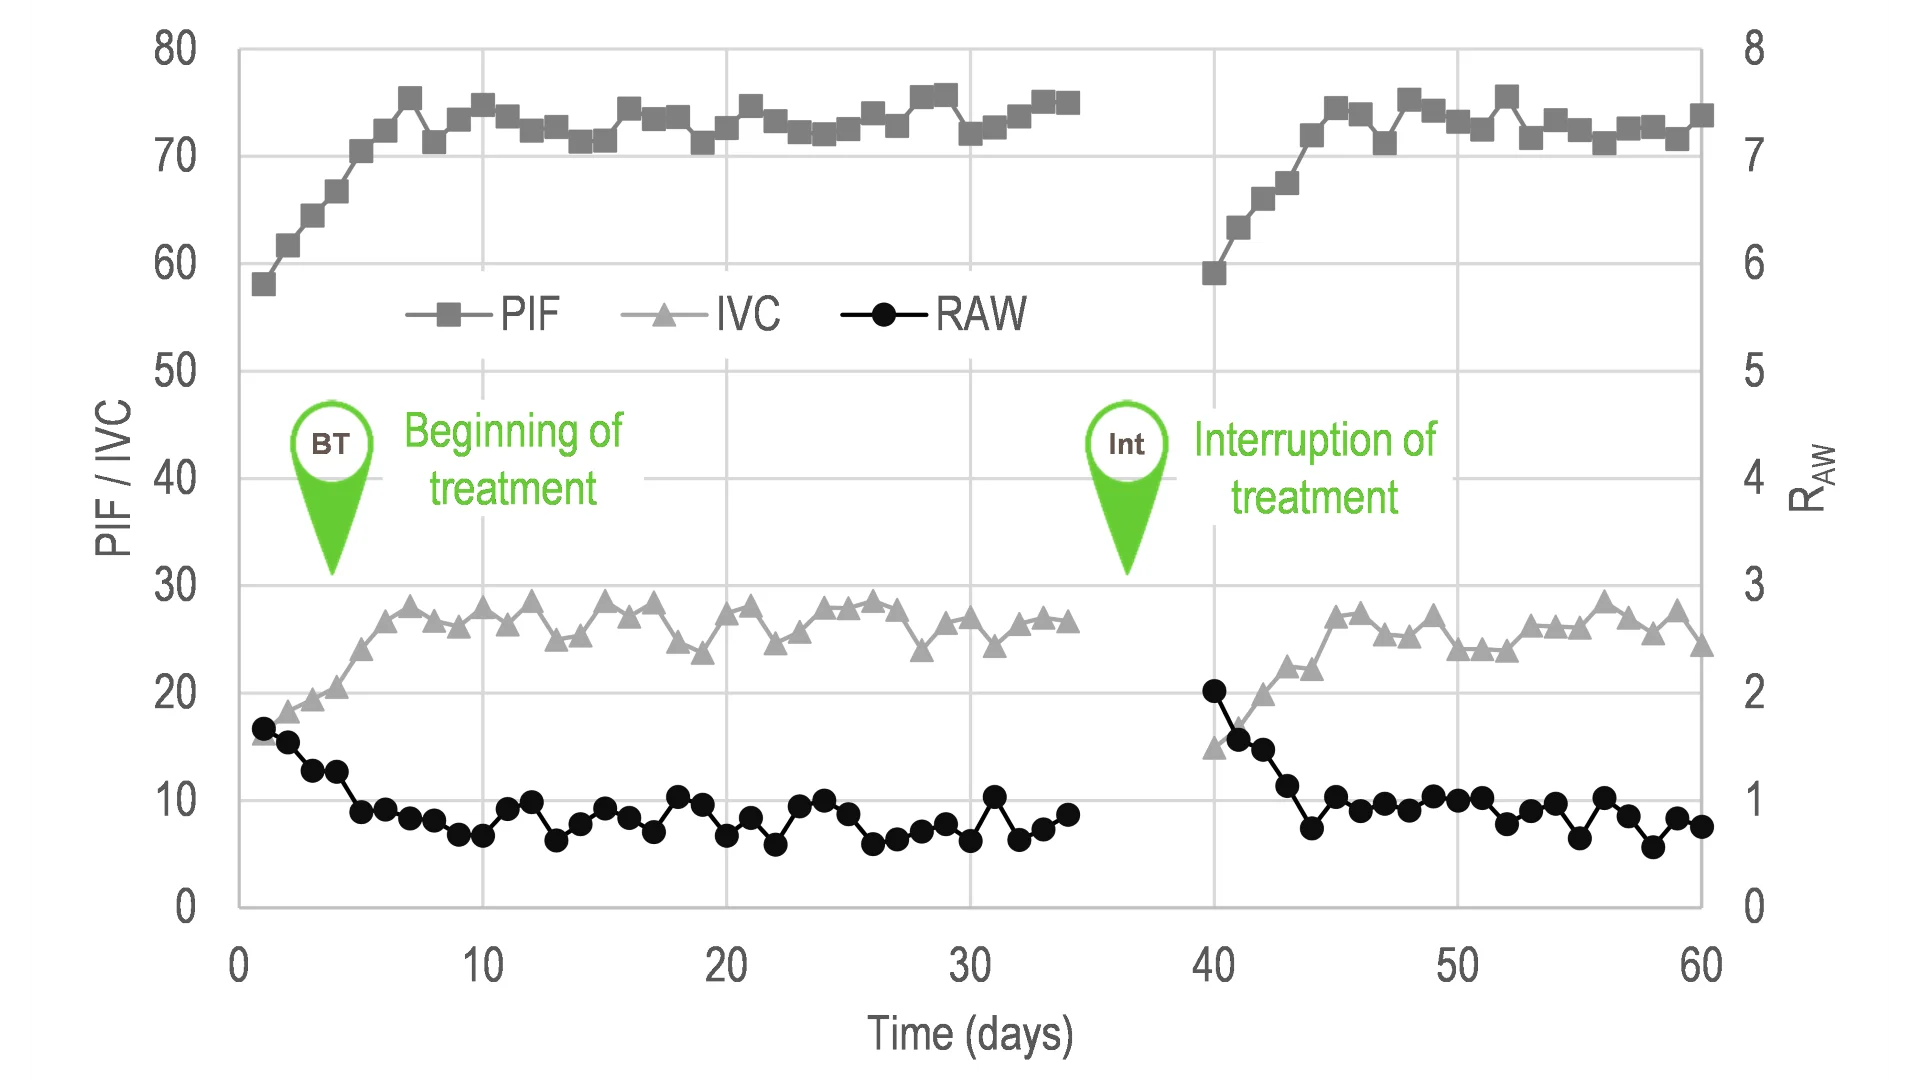
Figure 6: Peak inspired airflow (PIF), inspired vital capacity (IVC) and airway resistance (RAW) monitored over time
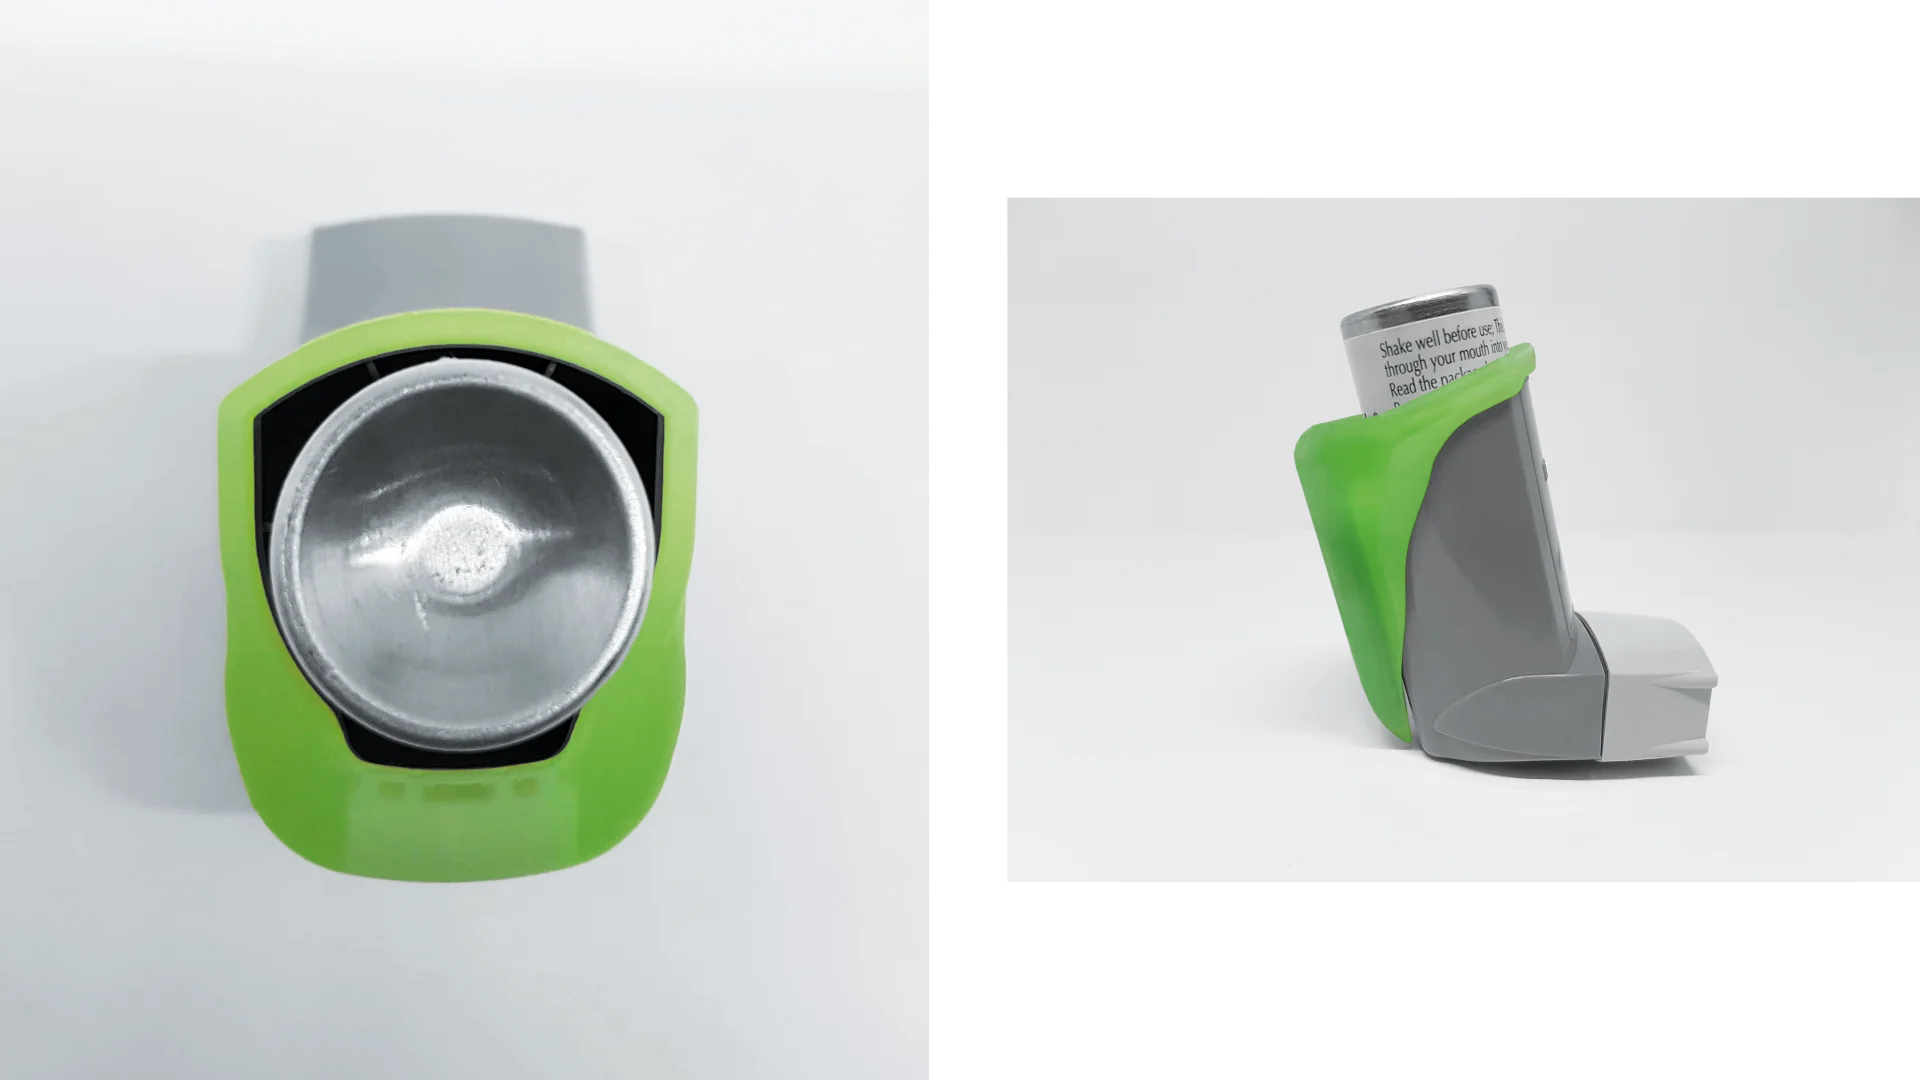
Figure 7: 3D-printed inhaler clip-on containing the Sensirion flow sensor SDP3x
Related sensors
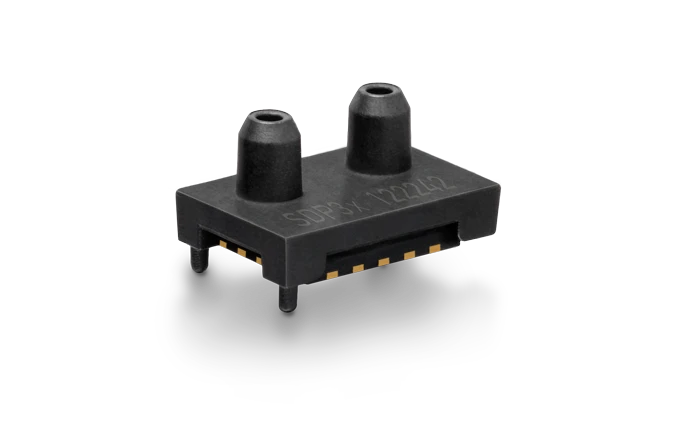
SDP3x
5
Creating space for your ideas