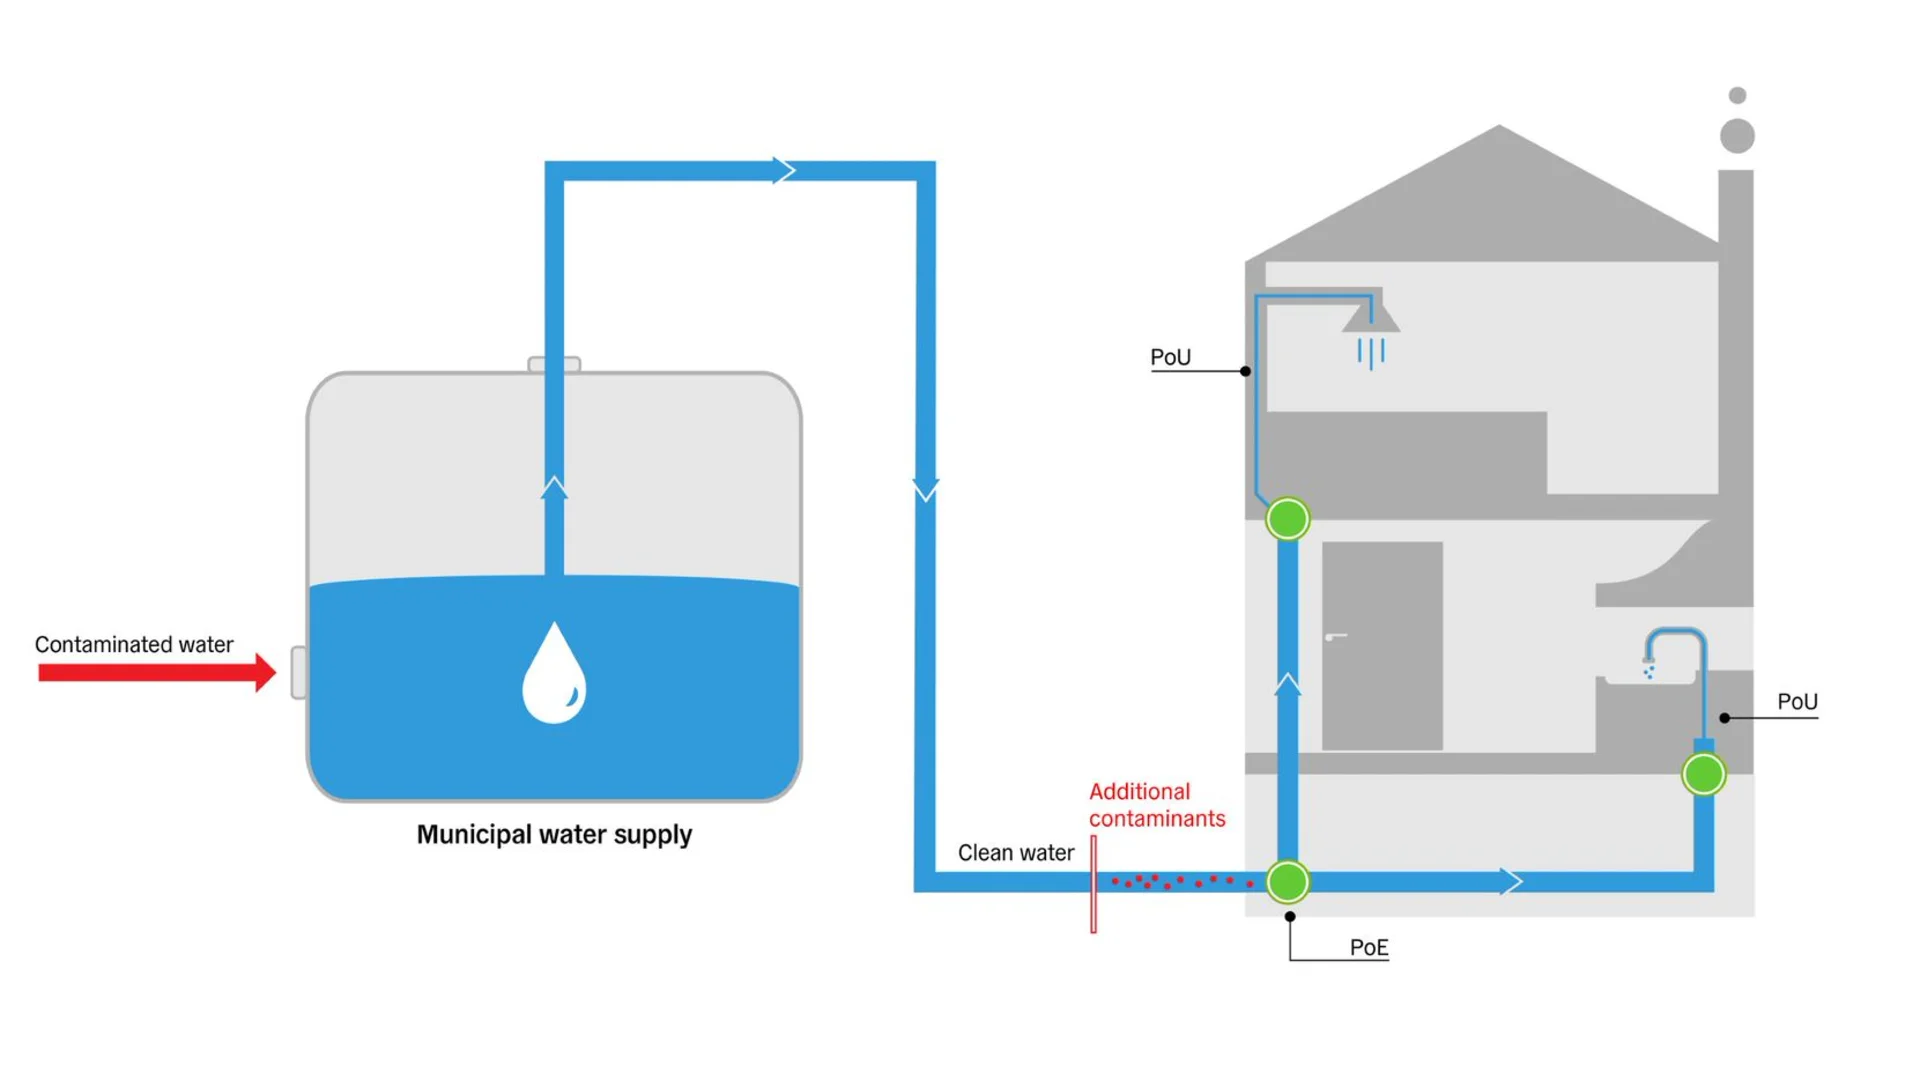
 Figure 1: Schematic of water supply and point-of-use and point-of-entry filters
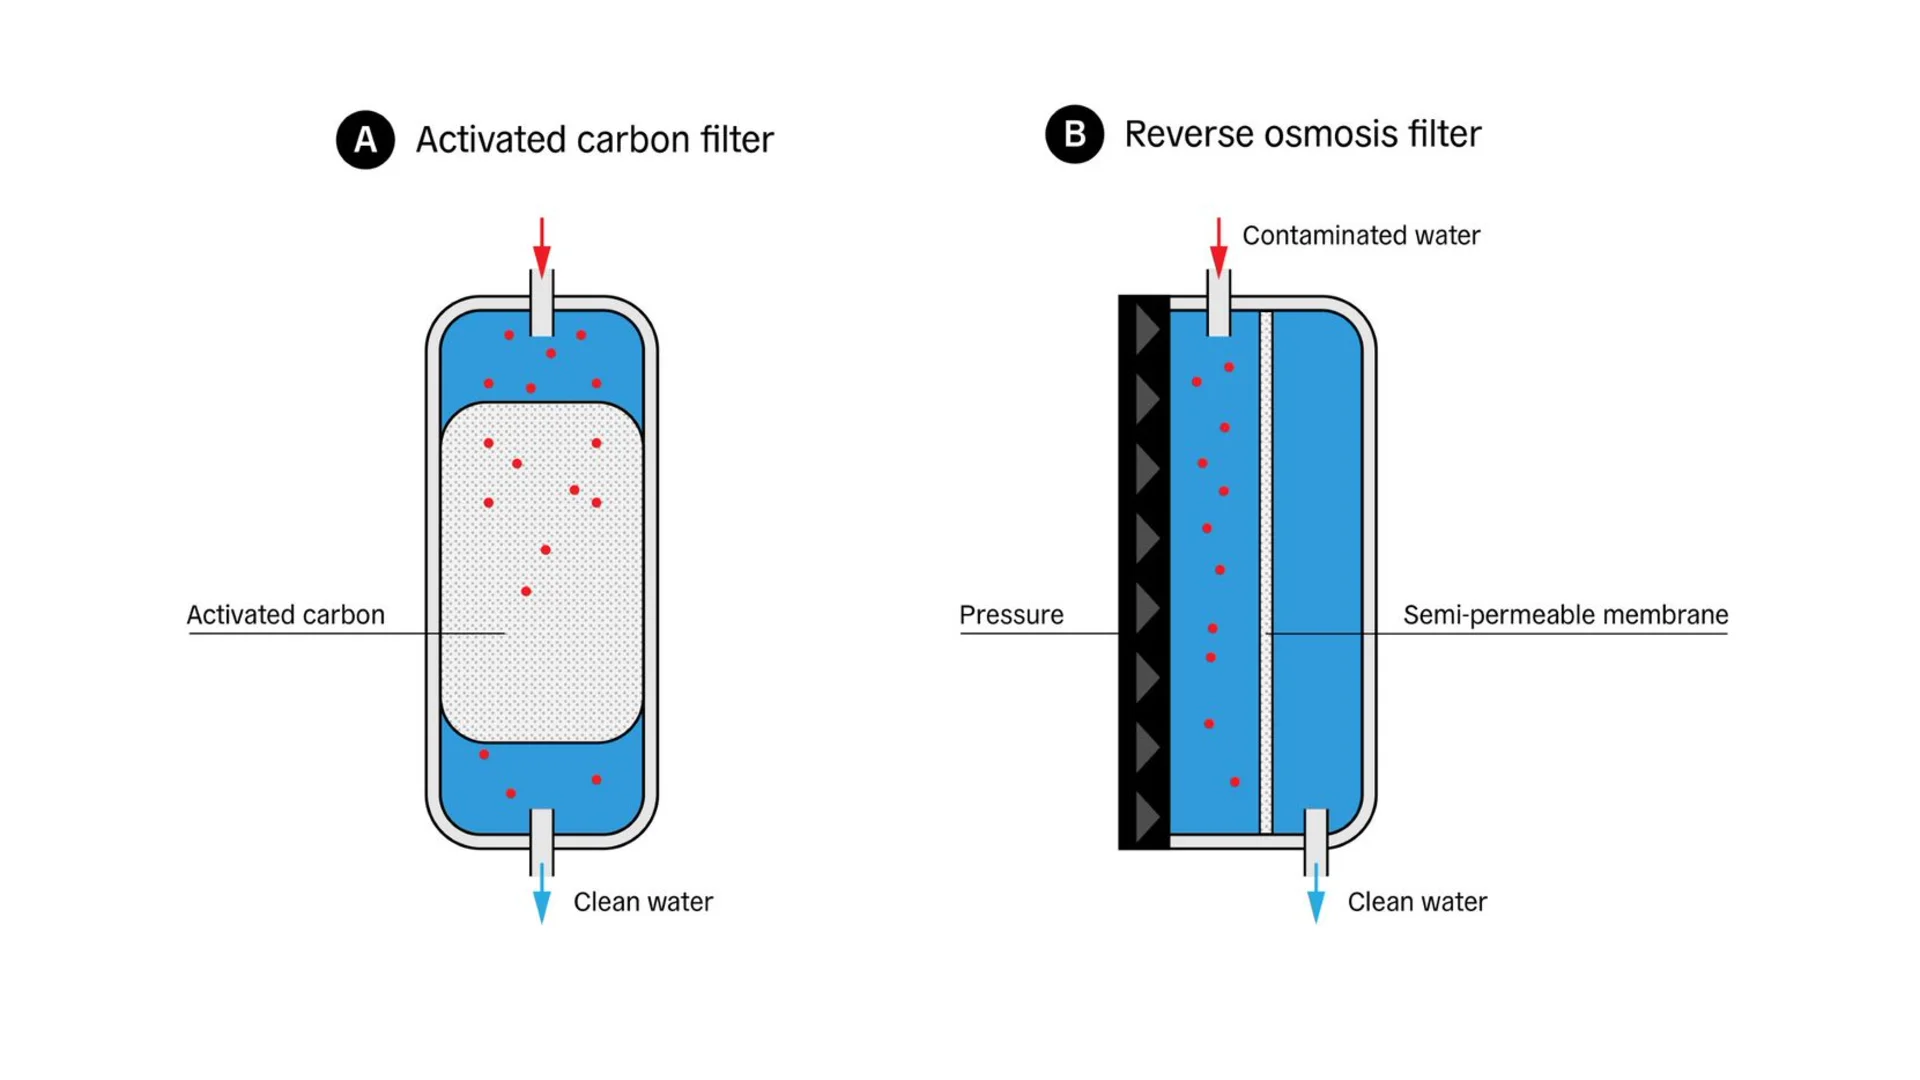
 Figure 2: Activated carbon (A) and reverse osmosis (B) filters
 Figure 3: Data from the sensor in front of the filter is denoted in black, data from the sensor behind the filter is green
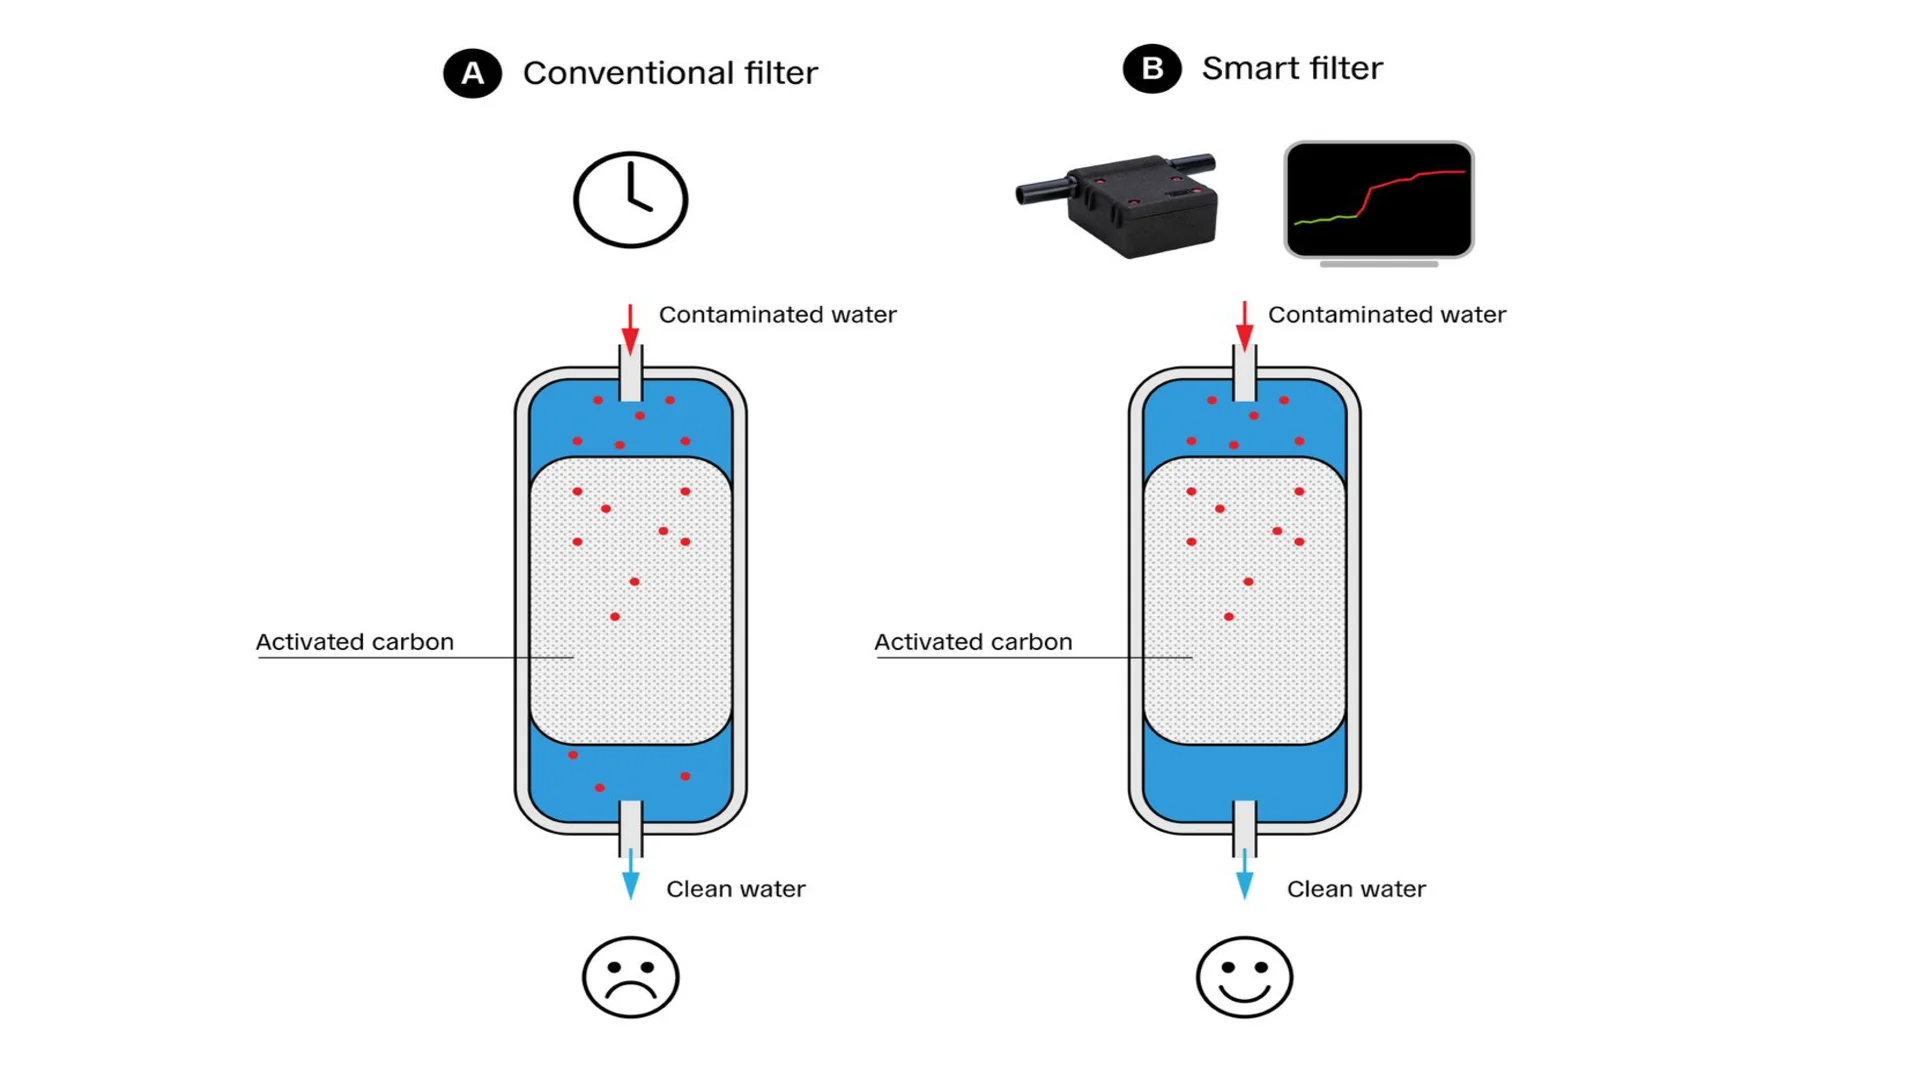
 Figure 4: Schematic of traditional filter versus smart filter


